PTA Complaint Management System Result Impresses
The recent report, released by PTA, shows that many consumers from all over Pakistan have entered their complaints successfully by following some easy steps. PTA has published the survey report on its website for the very first time.
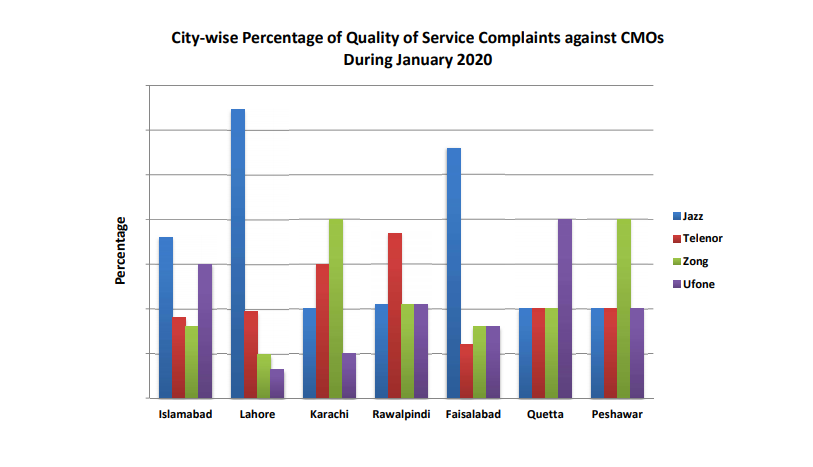
Lahore Gets the Most Complaints:
The above chart shows that the number of complaints received from Lahore is quite higher than other cities but as the subscribers’ rate is also high so it is the obvious thing that the complaint ratio will be higher. Following Lahore, consumers from Faisalabad lodged the complaints at a higher rate via an online system. While Peshawar, Quetta and Karachi are vibrating at the same frequency in the context of complaints lodging. The complaints from Islamabad and Rawalpindi are comparatively lower than other cities.
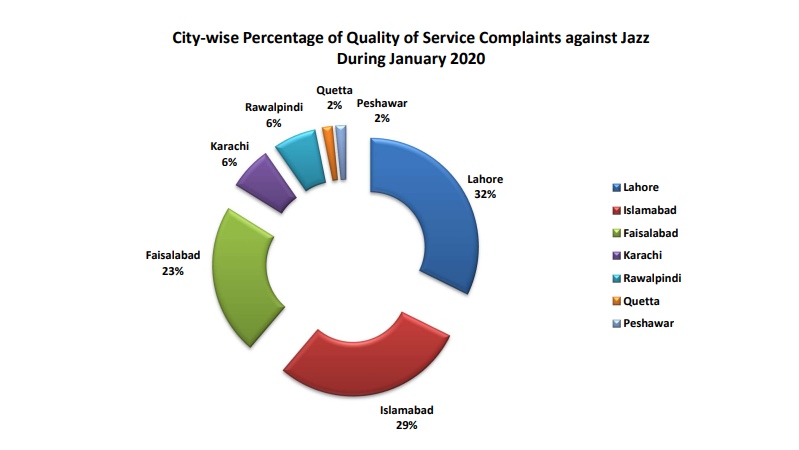
City wise percentage of Quality Service complaints against Jazz:
When it comes to the city-wise percentage of quality of service complaints against the Jazz during 2020, the above pie chart shows that 32% of complaints are lodged by consumers in Lahore, 29% in Islamabad, 23% in Faislabad, 6% in Karachi, 6% in Rawalpindi, 2% in Quetta and 2% in Peshawar.
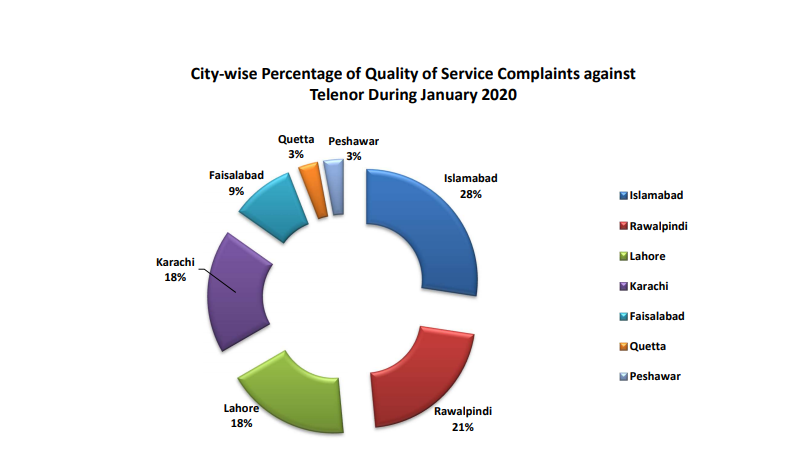
City wise percentage of Quality Service complaints against Telenor:
The above pie chart is showing the City-wise Percentage of Quality of Service Complaints against Telenor during January 2020. Consumers in Islamabad have registered a higher number of complaints as compared to other cities. 28% of complaints are lodged by consumers in Islamabad, 21% of complaints are lodged by consumers in Rawalpindi, 18% of complaints received in Lahore and Karachi. While 3% of complaints are received in Peshawar and Quetta against Telenor.
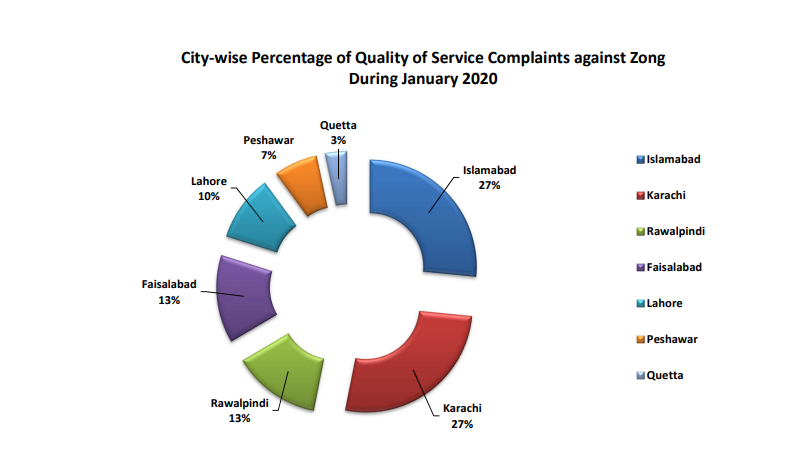
City-wise Percentage of Quality of Service Complaints against Zong:
During January 2020, 27% of complaints lodged by consumers in Islamabad and Karachi against Zong while 13% in Faisalabad and Rawalpindi. In Lahore, 10% of consumers lodged the complaints while in Peshawar and Quetta 7% and 3% of complaints have been received.
City-wise Percentage of Quality of Service Complaints against Ufone:
The Complaints against Ufone during January 2020 in Lahore are 53.3% while in Quetta, Peshawar and Faisalabad there are 0% of complaints. 6.7% of complaints are registered in Rawalpindi and Karachi. Consumers in Islamabad have lodged 33.3% of complaints.
Billing Related Issues:
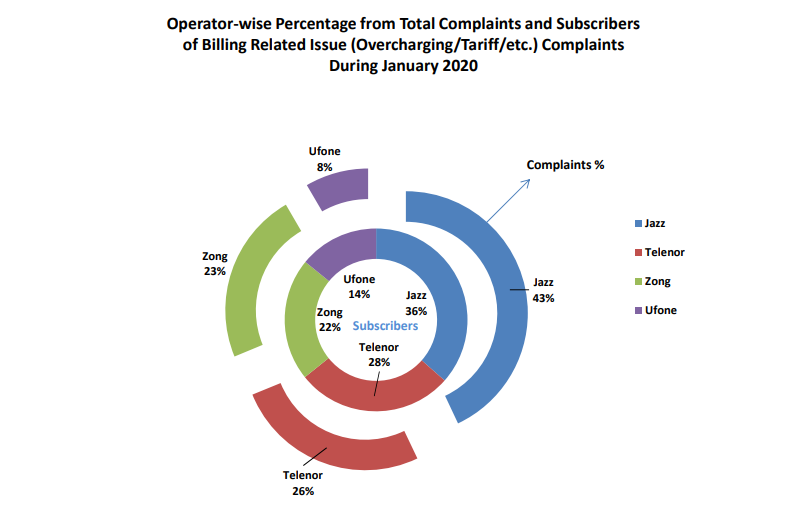
When it comes to the Operator-wise Percentage from Total Complaints and Subscribers of Billing Related Issue (Overcharging/Tariff/etc.) Complaints during January 2020, the above pie chart is presenting the clear picture. The chart is showing the ratio of Total Complaints and Subscribers of Billing Related Issue (Overcharging/Tariff/etc.) Complaints. We can see in the pie chart that PTA received the overall 43% of complaints against Jazz, 26% against Telenor, 23% against Zong while 8% against Ufone. 36% of subscribers lodged the complaints against the Jazz related to billing issue. 28% of Telenor consumers lodged complaints against the billing issue. 22% of Zong and14% of Ufone consumers lodged the complaints related to the billing issues.
City-wise Percentage of Billing Related Issues:
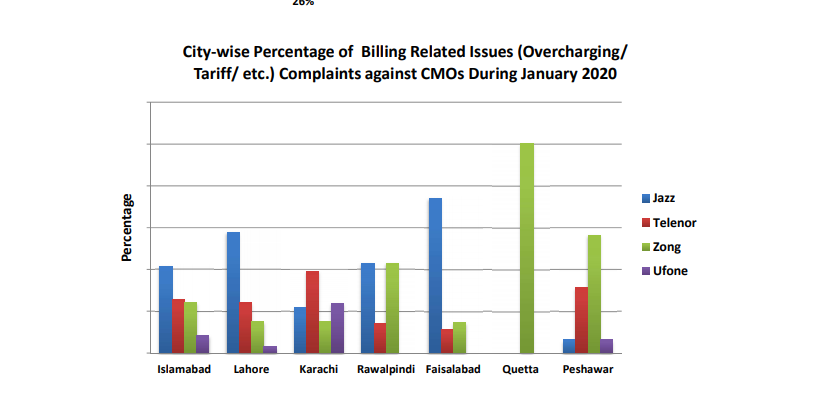
Zong users in Quetta lodged the higher number of complaints than other cities related to a billing issue, which include overcharging and tariff etc. But when we look into the chart, there are no complaints related to billing issue against any other operator in Quetta. In Peshawar, the complaints against the Zong related to the billing issue is also higher than in other cities but obviously, lower than Quetta. In Islamabad, Rawalpindi, Faisalabad and Lahore, consumers lodged the higher number of complaints against the Jazz related to the billing issue. Consumers in Karachi Lodged the higher number of complaints related to billing issue against the Telenor. All the above data has been taken from PTA website. PTA has shared this data publicly for the very first time and from now onwards, it will share this data on a monthly basis. Recommended Reading: PTA Augments Further Rules for Mobile Type Approval Technical Standards
